

Business
Data Science
Using Big Data analytics and Advanced Reporting in retail: A game-changer for convenience stores


In the fast-paced world of retail, convenience stores face many daily challenges: managing inventory, staying competitive, meeting customer demands, and adapting to changing market trends.
These challenges are amplified by the fact that many convenience stores are not using the potential of data they collect, or worse, not collecting data at all. This lack of data-driven decision-making often results in missed opportunities for growth and efficiency.
A report by IBM shows that retailers who use Big Data create a significant competitive edge.

So why don’t more retailers use Big Data solutions? In this article, we’ll explore the benefits (and challenges) of a data-driven approach to retail and use cases.
Key hesitations in adopting Big Data solutions in retail
Big Data means something entirely different for every person you ask. Let’s start from the basic definition – Big Data is a collection of large data sets that companies analyze to spot patterns and trends.
The thing about big data is however that traditional methods (think of Excel or legacy software) don’t work well because they can’t process huge amounts of data quickly. In the world of retail, the amount of data collected is just too big. Even if you start out today with basic data collection, in a year, you’re going to have to scale up.
So the next step is to implement new tools and software. Through our experience on the field, owners had the following reservations when we suggested the implementation of Big Data collection and analytics tools:
- The cost of implementation
The costs of data strategy for a company can range from $50.000 to $150.000, depending on a scale. Maintaining the system and processing the data also moves often in that range, or even higher. It’s no wonder almost half of businesses in the US operate with a “limited data strategy”.
- The complexity of data analysis
Implementing a tech solution is not the solution by itself. Analyzing data and deriving insights is the key. This requires that many businesses either hire data specialists and business analysts or collaborate with external agencies.
- The security of data
Due to the sensitive nature of data sets and potential risks involved, the decision making time prolongs because it takes time to develop trust in your software or analysis-as-a-service vendors. Especially if the vendor is from another country and laws and regulations around data differ greatly. The number of data compromises has been steadily increasing in the past 15 years, with more than a thousand incidents in 2022 alone.
- Training period for the staff
Many data science and business intelligence companies offer customizable and user friendly software. However, this incurs additional costs as your employees might have never used similar software. The shift from processing data in e.g. Excel to another software is a considerable obstacle.
- Personalized solutions vs off the shelf (and the price tag attached to it)
The bigger the business, the greater the customizations. There are many data collection and analysis tools on the market. Yet, there’s always a need for a “one more feature”.
Off the shelf solutions are great for starters, but there’s the cost-benefit analysis of shifting from the old ways to new ways, when the off-the-shelf solution isn’t enough and the business suprasses it.
It’s easy to get overwhelmed by these concerns and miss perhaps the biggest benefit of the Big Data in retail
These are all regular business obstacles and many companies on the market more or less cover all the bases. Let’s just say that the entire market of Big Data analytics is set to grow at a staggering rate in this decade. This speaks volumes about companies (thinking about) adopting real data-driven decision-making.
At Smart Cat, we solve many of the issues above by combining all the crucial departments under one roof – data engineering, data science, and data analytics. Our Business Analysts make sure we get the pricing and business models right. We also create customizable and simple, business people oriented Big Data products.
For example, we’ve built a Data Lake House, a data-and-industry-agnostic solution that enables data collection and processing at one place in realtime, while enabling scaling up or down per need.
However, this is all sales talk.
What most convenience store owners actually want to see is the real-life value as quickly as possible, not hidden in piles of technical specifications and without going through two-hour long sales pitches in vain.
The key feature most of the market looks for is Advanced Reporting, beyond sheets and static data. That’s the feature that provides the most value and makes the obstacles more soft. Because why would you create fancy solutions that do the same things as the one you’re using now?
Traditional vs Advanced Reporting for convenience stores
Traditional reporting usually focuses on describing the current and past states of various metrics, instead of predicting the future or detecting patterns that are not immediately obvious.
Here are some of the key characteristics of traditional reporting:
- Historical Analysis: Traditional reporting often looks at past and current data. This can include anything from sales data, customer data, operational data, etc. These reports are typically created on a set schedule, such as daily, weekly, or monthly.
- Static Reports: These reports are usually created and then distributed without further changes, meaning they’re static.
- Pre-defined Metrics: Traditional reports usually focus on key performance indicators (KPIs) and metrics that the business has defined as important. This could be revenue, number of new customers, customer satisfaction scores, etc.
- Tabular and Visual Formats: Traditional reports often present information in tables or charts. They may include summaries, averages, totals, and other statistics.
- Limited Interactivity: Traditional reports usually don’t offer much in the way of interactivity. They are designed to be consumed as is, without the ability for the user to drill down into the data or change the parameters of the report.

Here’s an example of one such report. Source: Numerator
In contrast, advanced reporting techniques such as predictive analytics, data mining, machine learning, and others, are used to predict future trends, detect complex patterns, or extract insights that aren’t immediately obvious from the data.

Source: A sample advanced report we implemented in PowerBI / Smart Cat
Together with all of this data, advanced reporting features provide interactive dashboards that offer insights, forecasts, detect patterns and anomalies in data, and more. This level of interactivity and detail allows businesses to delve deeper into their data, uncovering insights that would otherwise remain hidden.

Predictions of customer behavior. Source: Smart Cat
These kinds of reports allow for better understanding and planning across the organization. Marketing and sales departments can adjust campaigns on the go. Inventory management and planning becomes easier (especially with integrations). Operational logistics can plan ahead.
Let’s imagine a simple coffee shop chain.
Traditional reporting might involve creating regular reports on the number of coffees sold per day across all outlets. The report might break down sales by type of coffee (latte, cappuccino, espresso, etc.) and by store location. This static report would be generated daily, weekly, or monthly to inform managers about sales performance.
For instance, a traditional report might show:
– Store A sold 500 cups of coffee today, 250 of which were lattes.
– Store B sold 700 cups of coffee today, 300 of which were espressos.
These reports would help managers understand which types of coffee are the most popular and which stores are performing the best. However, they don’t provide much insight beyond that.
In contrast, advanced reporting would involve more complex analyses that provide deeper insights or predictions about future trends. For instance, a coffee shop might use machine learning algorithms to analyze sales data, along with external factors like weather, local events, and demographic data about the local population.
This kind of advanced reporting might reveal insights such as:
- Sales of hot coffees increase by 20% when the temperature drops below a certain threshold.
- Store A’s location has a high concentration of office buildings, so it sells more coffees in the morning. Store B, on the other hand, is located near a college campus, so it sells more coffees in the afternoon and evening.
- A new local event (like a music festival) is likely to increase coffee sales by a certain percentage.
Advanced reporting can thus provide much more actionable insights, enabling the coffee shop to predict future sales, optimize their operations, and make data-driven decisions about things like store hours, staffing levels, and promotional activities.
A mid-sized convenience store chain used advanced reporting to reduce churn
One of our clients, a convenience store chain, used the solution similar to the one above, to reduce customer churn. Their inventory management process was slow. Customer experience was suffering.
We implemented a pattern analysis, anomaly detection, smart suggestions, and insights as well as forecasting. Interactivity enabled anyone in the company to understand the data and make impactful decisions.

Source: A sample report in PowerBI > Smart Cat
The end result? Reduced customer churn and better performance in terms of both revenue and customer satisfaction. The client managed their inventory more efficiently and predicted customer behavior (popular products, new trends, time of day…) resulting in improved customer satisfaction and increased revenue.
Do you want to experience how the solution might look in your convenience store? Try this open-access online version in PowerBI. No sign in required. Just play around with the report. Let us know if it’s simple (yet powerful) enough.
Everyone says they can’t predict anything until they find out how to really analyze the data
We sure can predict that the future of retail and maintaining a competitive advantage lies in data.
The use of Big Data analytics and Advanced Reporting in retail, particularly in convenience stores, is a must because your customers are more demanding than ever, and your competitors are already using the tools.
The potential benefits – improved inventory management, better customer understanding, and increased competitiveness – are significant. Data science offers a way to make decisions that are informed by data, not just intuition.
However, it’s important to acknowledge that implementing the tools alone is not a magic solution that instantly solves all problems. The idea is not to replace human judgment, but to enhance it with data-driven insights.
Related blog posts:

Business
Company Culture
After a mile in your own shoes
This article is people-focused. SmartCat is a small group of people. These are simply rare to find. And this basic trait is the first thing we check for. This is why we are proud of who we are. This why we are not afraid of admitting our mistakes and challenging each other’s ideas. This why we are a no-bullshit-company.

|
Jul 09, 2021

AI AGENTS
AI Assistant
AI Agent vs AI Assistant: Key Differences, Benefits, and Use Cases
How many hours does your team lose each week chasing emails, answering the same customer questions, or juggling routine admin tasks? For most businesses, the number is staggering. According to McKinsey, employees spend 60% of their time on repetitive tasks that could be automated. But the solution isn’t just to slap on any kind of […]

|
Sep 26, 2025
Data Analytics
Data Platforms
Data Science
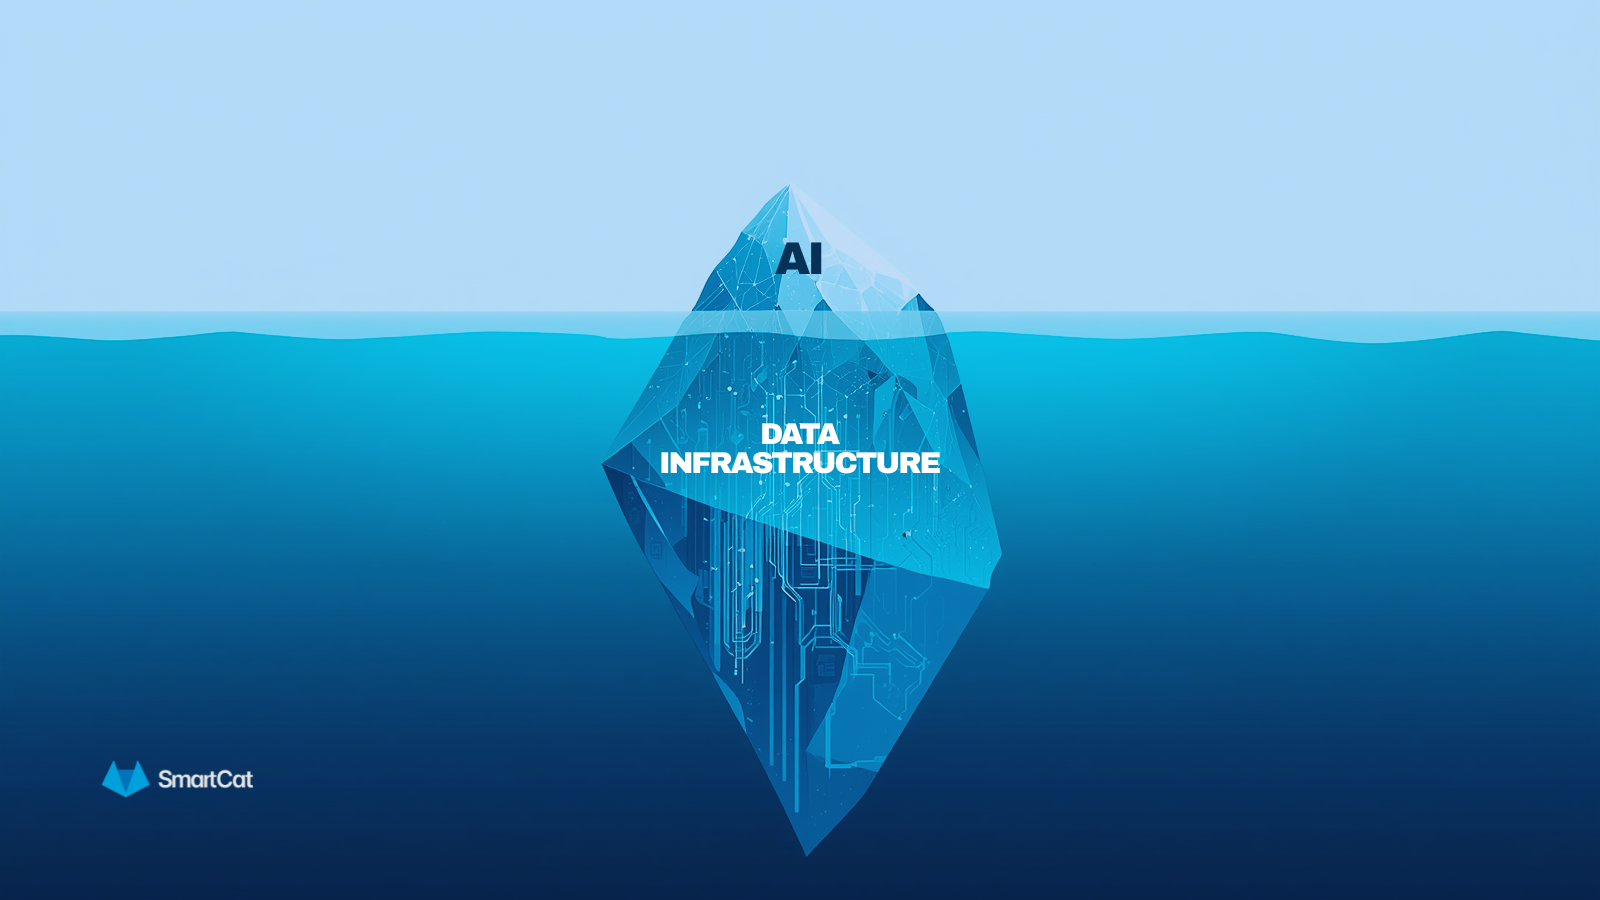
There Is No Data Shortcut: AI Requires Foundations That Cannot Be Built Overnight
This article was originally published in the Serbian tech magazine Internet Ogledalo, and its special edition “DATA 2026: The Power of Data in the AI era”. You can find the Serbian version at Internet Ogledalo. Here is what organizations expect from artificial intelligence in 2026: management wants higher productivity, faster decision-making, and the automation of complex […]
|
Jul 30, 2026